Finally see how to stop getting stuck in a project management tool
Book a Live Demo20 min. personalized consultation with a project management expert
Spreading the Spreadsheet Knowledge
A rundown on functions, formulas, and everything in between

When spreadsheet software was first introduced to personal computers in the 1980s, it was considered a ‘killer application’. It was a program that was so desirable that people would rush out to purchase computers just so that could use the app. Nowadays, although not a killer app, spreadsheets are still heavily used both in a business and personal context. As valuable as ever, they simplify processes that would otherwise have to have been figured out manually (who has the time for that?!) — here’s what else they offer.

First Thing’s First, What Is a Spreadsheet?
A spreadsheet is a file made out of rows and columns that simulates a paper worksheet. A useful way to store information, it is also ideal for data organization and analysis. Or as Technopedia defines it;
Spreadsheet Definition:
A ‘software application that enables a user to save, sort, and manage data in an arranged form of rows and columns. It stores data in a tabular format as an electronic document. An electronic spreadsheet is based on and is similar to a paper-based accounting worksheet. It may also be called a worksheet.’
Spreadsheets have come to replace paper-based systems, and although originally used for accounting and bookkeeping purposes, they are now widely used for many other reasons. Extensively used in day-to-day business operations, they can also be used for personal affairs or wherever there’s a need for tabular content to be created, stored, and shared.
A Brief History of Spreadsheets
Paper spreadsheets had been used by accountants for hundreds of years. According to industry jargon, the term ‘spreadsheet’ refers to a large sheet of paper with columns and rows that organize data about transactions for a business person to examine. It presents all of the costs, income, taxes, and other related data on a single sheet of paper for a manager to analyze when making a decision.
Electronic spreadsheets were first introduced to the world through software called VisiCalc in 1979. Daniel Bricklin, who is often referred to as the ‘Father of the Spreadsheet’, co-created VisiCalc with Bob Frankston, which was the first spreadsheet program available for personal computers. So successful was the software that it was not only considered Apple’s killer app — as it was originally released for the Apple II — but it sold as many as 1 million copies over its history.
In 1983, Lotus 1–2–3 was launched, and sales for VisiCalc went downhill. Lotus 1–2–3’s success is owed to its taking full advantage of the expanded memory and screen of the PC. It was marketed as a three-in-one integrated solution that managed spreadsheet calculations, database functionality, and graphical charts. Now discontinued, it was the most commonly used spreadsheet application throughout the 1980s and 1990s. Only until Microsoft Excel came into the picture in the early 1990s did sales for Lotus 1–2–3 start to decline and 2013 saw sales officially ending.
Since 1993 Microsoft Excel has been running the digital spreadsheet game. Part of Microsoft Office, the application features calculation, graphing tools, pivot tables, and a macro programming language called Visual Basic for Applications. It is used on Windows, macOS, Android, and iOS, and has become the industry standard since its version 5 release in 1993.
Then in 2005, with the advancement of web technologies, online spreadsheets arrived. Also known as ‘Cloud Apps’, web-based spreadsheets have the same features as desktop applications and include multi-collaboration user and real-time update features on top of that.
Spreadsheet Features
Spreadsheet templates are available on software such as Microsoft Excel, Google Docs, and OpenOffice to both business and personal users. Although each application may have its distinct components, most share the following common features:
Basic Operation
- Cell: A single data point, individual box, in a spreadsheet.
- Column: The vertical set of cells on the spreadsheet that are labelled alphabetically.
- Formula: A sequence in a cell used to obtain a specific result. It can be a combination of functions, cells, rows, columns, and ranges.
- Function: A predefined formula that can calculate cell, row, column, or range values.
- Range: A group of cells extending across a row, column, or both.
- Row: The horizontal set of cells on the spreadsheet that are labelled numerically.
- Workbook: A collection of worksheets that stores all the data that you have entered. Saved together in one file, it can be viewed by multiple users on a network (this is also known as a Shared Workbook).
- Worksheet (sheet): A workbook is made up of a collection of documents known as worksheets. Saved together on a single file, one spreadsheet can have multiple worksheets.
Spreadsheet Graphics
One of the most revered elements of a spreadsheet is its ability to include graphics. Charts, graphs, and histograms are visual representations of the data you store, organize, or analyze. They are generated from specified groups of cells and can be either embedded within the content or added separately. The benefit of using graphics is that it summarizes your data and visually explains the content. If you were using a spreadsheet for a presentation, for example, adding a chart, graph or histogram can give your audience a better grasp of the information being presented (as opposed to just showing them row after row of ‘meaningless’ numbers).
Types of Spreadsheets
Spreadsheets weren’t always the same as what we know (and love) today. Here are the different kinds of spreadsheets that have existed:
Two-dimensional spreadsheets
In the early years of spreadsheets, cells were simply a two-dimensional grid. Which basically meant that each cell held a piece of data that was organized in rows and columns.
Three-dimensional spreadsheets
Spreadsheets then evolved to allow more than one two-dimensional worksheets that relate to stacking on top of each other. This is the type that we’ve become accustomed to.
Arithmetic spreadsheets
This type of spreadsheet is when arithmetic functions are utilized. Function examples include automatically finding the average of the cell values of one column, or adding the value of one column.
Logical spreadsheets
These refer to spreadsheets that have a formula language based on logical expressions instead of arithmetic expressions.
Desktop (Local) vs Online Spreadsheets
Spreadsheets that are used today are either from a desktop application or online. One relies on an operating system, while the other operates using a web browser. Which version is the better one highly depends on what your requirements are, and what it is you are looking to achieve from your spreadsheet.
Before comparing their pros and cons, let’s start off with the features that you’ll find in both the desktop version and its online counterpart.
- Instant complex calculations and adjustments
- Structured data can be stored, organized, analyzed, and filtered
- Generating code, keywords, and/or lists
- ‘Creating standard operating procedures’
- Both can be used on multiple platforms such as mobile, tablets, as well as computers
Stop juggling multiple tools and spreadsheets.
Try our all-in-one project management software for free now!
Desktop Spreadsheets
Pros:
The most popular and commonly used desktop spreadsheet application is Excel. There are many things you can do with Excel, from automating workflows to creating charts, to even making art! Storage-wise, the desktop is the way to go if you are working on big projects that require 10,000+ lines. That’s because cloud-based applications aren’t able to process as large amounts of data as native applications can.
Cons:
Learning an application like Excel doesn’t happen instantly. Getting even the basics down will take a lot of practice and maybe even classes. Cost is also a factor as most desktop applications don’t usually come free.
Online Spreadsheets
Pros:
Cloud-based spreadsheets, such as Google Sheets, are often free to use and offer great collaboration features. Real-time collaboration features are so refined you can even decide the level of collaboration a user can have on a particular worksheet. Also simple to navigate, all it takes is clicking on ‘edit Google spreadsheet’ and you and your team can make changes to the work instantly.
Cons:
Storage-wise, online spreadsheets don’t offer as much space as desktop versions. They also lag in terms of versatility. While Google Sheets, for example, does have similar features as Excel, it doesn’t include everything that the latter offers, and not all formats are supported on the online version. Another downside is that, unlike Google Sheets, not all web-based spreadsheet tools can be used offline (the clue is in its name, obvs) which means you’ll need an internet connection to ensure that your work is being entered, edited, and synced with others’ properly.

Benefits of Using Spreadsheets
It’s a no-brainer that using a digitized version of a paper worksheet has its benefits. The thought of not having to constantly re-write edits and updates alone is reason enough. Here are some other perks:
Instant Calculations
One of the biggest advantages of using spreadsheets is the instant calculations made by formulas. Cells can be set up with formulas which can calculate the data based on the content of the other cells. Not only can this be a time-saver, but as long as the formulas are entered correctly, it can reduce the chances of error.
Easy Collaboration
Digital spreadsheets are great for teams who need to share data and collaborate on work. All file sharing entails is saving the spreadsheet, downloading and sending it via email or instant messaging. If you’re using an online spreadsheet app, then file sharing is made even easier through its real-time collaboration features where team members who have been invited to work on a document can make live edits.
Forecast Scenarios
Spreadsheets support data modelling which can help users forecast specific scenarios. For example, a personal user may use a spreadsheet’s basic data modelling to predict what may happen to their monthly budget if their rent was increased. A business user on the other hand would tap into more complex data modelling to analyze something like the company’s yearly expenditure to see if there was room for cost cuts.
Gives Meaning to Data
Using spreadsheets can unlock data potential. What this means is that the data you’ve entered can be organized, stored and/or presented in a way that’s more than just a bunch of numbers. Formatting and styling customization options give users the chance to improve the readability of their information, and to transform their data into visual presentations, using charts and graphics. This will give more meaning to the data as visualization gives us humans a better chance to respond to and process visual data better than any other type of data.
Ways to Use a Spreadsheet
Spreadsheets are an essential asset in the everyday administration and operation of a business. They are also extensively used for personal purposes as well. Here are some spreadsheet examples of how they can be utilized:
Store and Organize Information
Whatever your data is, whether it’s telephone numbers, calculations, dates, or employee details, using a spreadsheet to hold information is one of its most common purposes. But the beauty of them is that they also allow you to organize your data as well as store it. For instance, let’s say you’ve decided to use a spreadsheet to store telephone numbers, it will give you the option to sort the details by alphabetical or even numerical order.
Presentation
Another common use of spreadsheets is to present data, especially for presentations in business meetings and university assignments. Once you’ve entered and organized your information, it gives you the ability to view the data in various graph and chart forms. Illustrating trends and percentages offer a better understanding than raw numbers. Bar graphs, pie charts, line and scatter charts, and surface and area graphs are just some examples of how your data can be presented on a spreadsheet.
Manage Finances
Since their main spiel is numbers, spreadsheets are a great tool to organize financial data. Many accounting and bookkeeping departments of businesses use electronic spreadsheets to manage their company’s income and expenses (after all, it was created for this exact purpose).
Finance management isn’t exclusive to businesses. Those looking for a way to manage their personal finances can also use spreadsheet templates from home versions of software apps such as spreadsheet Excel. It’s an ideal tool to use to keep track of your budget and to record transactions and receipts of your household.
Organization
With the way the rows and columns are set up, spreadsheets can also be used to manage data that isn’t numerical. A great way to stay organized, here are a few things you can create that will keep you on top of things:
- Tables: Create personalized timetables for study, fitness, activities, or dietary purposes. Businesses can also create tables to manage things such as inventory and timesheets.
- Lists: Nobody can live without lists, they’re a great way to help you keep things in check. Create to-do lists, checklists, grocery lists, or whatever kind of list your heart desires.
- Forms: Create forms to capture, organize, and edit data. Some form examples include evaluations, performance reviews, and timesheets at work, or creating quizzes and surveys for personal use at home.
Project Management
Spreadsheets are a great tool to use to track tasks within a project. Information associated with the tasks, such as the person responsible for them and the activities attached to them, can be recorded and then tracked throughout the project’s entirety.
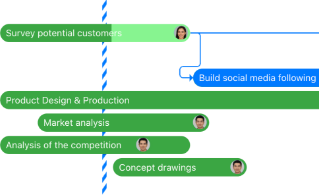
Project managers looking to use a visual project management tool can use a spreadsheet to create a Gantt chart. A Gantt chart is a bar chart that visualizes your project schedule. It uses a vertical task list against a horizontal time scale design to highlight the structure of the project work (which is broken down) and the relationships between the activities. A great tool to have in your project management toolbox, this visual aid offers transparency, flexibility, and accountability, and makes your overall project more manageable.

Spreadsheets in Zenkit
Project managers or personal users who are already using Zenkit for their projects and task management will be happy to know that spreadsheets are also available in Zenkit. There are two ways to use them:
The first way allows you to easily import data from an existing CSV/spreadsheet file by creating a new Collection. This is handy for anyone who is looking to get started on things quickly. All it takes is a few steps, starting from the home page where you usually create a new Collection, choose which source you are importing from, upload or paste the data, rearrange how you want it to look, and then import the file. Click here for full instructions.
For those with data on an Excel or Google Sheets document, you can also import your existing data onto Zenkit. Download your spreadsheet onto your computer, and once it’s saved as a CSV file, you then follow the same steps as the instructions for importing data from a CSV spreadsheet. And click here for full instructions.
While Zenkit’s spreadsheets don’t yet have the full functionality of powerhouses like Excel, we’re working towards introducing more features all the time!
Final Thoughts
There is more to a spreadsheet than simply calculating numerical data — although, yes, that is a major plus of using one. For those who didn’t know prior to reading this article, we have shown you some different ways using a spreadsheet can help simplify processes at work or how it can add value at home. But the possibilities are actually endless, as proven by the genius who used it to create art.
From its emergence as a killer application and its two-dimensional grid to the feature-filled electronic and cloud-based software programs we know of — and love — today, spreadsheets have proven to be an integral tool for storing, sorting and analyzing our data. However and whatever it is you use it for, it’s safe to say that the evolution of the spreadsheet isn’t slowing down anytime soon.
Let us know if there are ways you utilize a spreadsheet that we didn’t mention. Who knows, maybe we’ll discover a new innovative way!
Cheers,
Dinnie and the Zenkit Team
FREE 20 MIN. CONSULTATION WITH A PROJECT MANAGEMENT EXPERT
Wanna see how to simplify your workflow with Zenkit in less than a day?
Book a Live Demo